
Long Term Uptrend Indicators
Long Term Uptrend Indicators
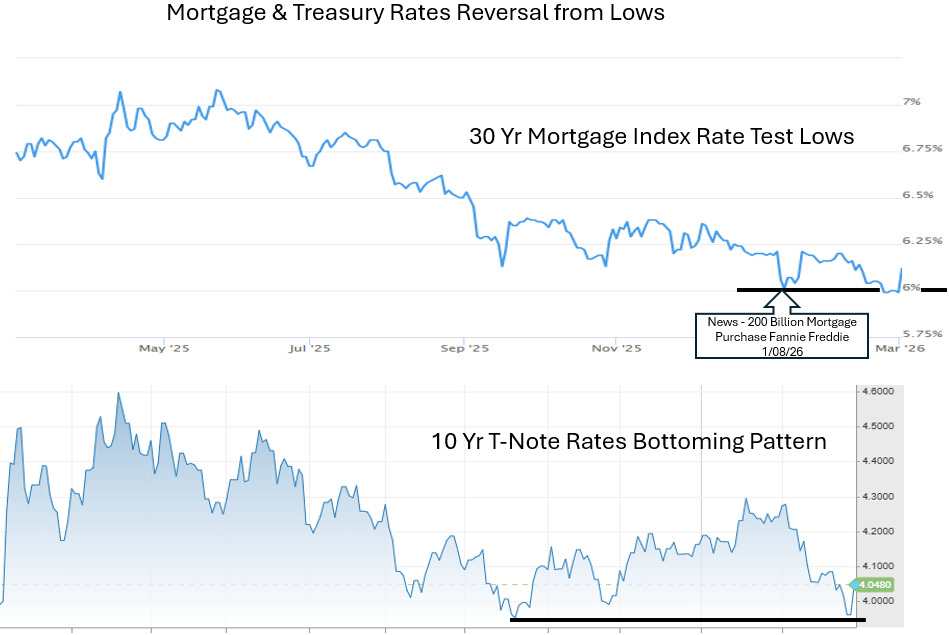
Overview: Mortgage rates have not followed through lower compared to the recent improvement in long-term Treasury rates. This suggests that mortgage rates are resisting moving lower and have an upward rate bias. On March 2, Treasury rates turned up abruptly from their yearly lows, as mortgage rates followed suit, increasing 0.125%, as reported in the 30-year Mortgage Rate Index (MND). Mortgage rates failed to demonstrate follow-through below 6.0%. This low & support level was established following the January 8 announcement of the Trump administration to mandate Fannie/Freddie to purchase mortgages.
Mortgage rates held at the 6.0% level, while the benchmark 10-year Treasury note rate improved, declining from a peak of 4.28% to 3.96% testing yearly lows.
Fannie/Freddie Update
The mandated mortgage purchase has required Fannie Mae and Freddie Mac to buy $200 billion in mortgages, which creates elevated risk of potential losses within their reserve inventory if rates move higher. So far, the 30-year mortgage rate MND remains above 6.0%, with a trading range high of 6.15%.
The unintended interest-rate risk burden placed on their new mortgage reserves can be significant. In January, Fannie and Freddie made the first reserve purchases, totaling $12.5 billion* in mortgages.
Fannie and Freddie Reserve Risk
If mortgage rates move higher, the investment value of mortgage or bond reserves falls. Investors will not pay the same price to own a 6.0% yield mortgage security if they can purchase new securities offering with higher yields in the market. Higher rates mean lower values on mortgage securities.
Technical Highlights: Test of Rate Lows; Upturn for Rates
1. The 30 Yr Mortgage rates bottomed at yearly lows following the $200 billion Fannie/Freddie purchase announcement, with no follow-through lower. A divergence occurred with the 10Yr T-Note Yield/Rate moving lower while the 6.0% 30-year mortgage rate held in place.
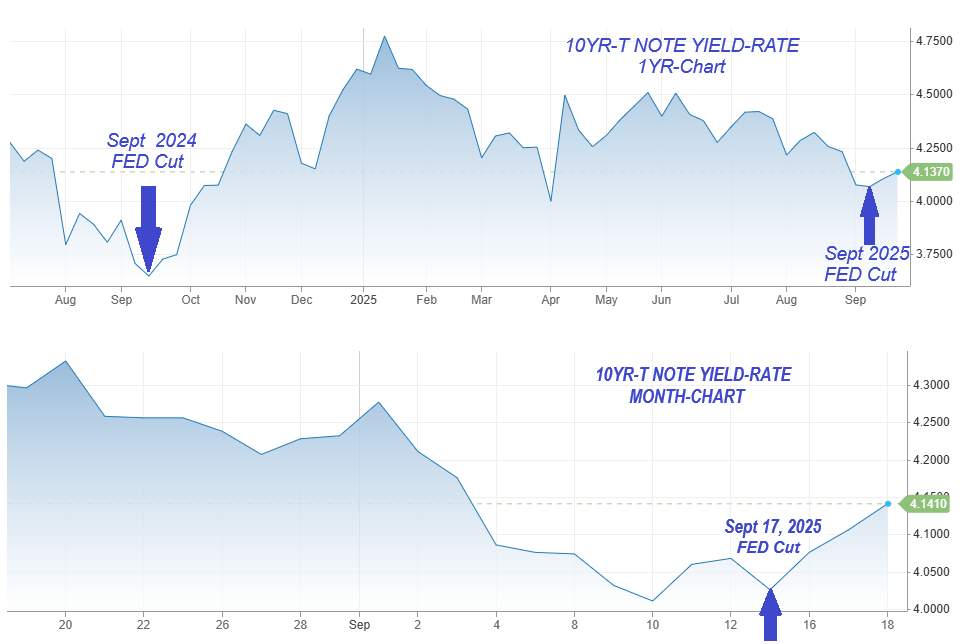
2. Treasury yields experienced a key reversal to the upside after testing yearly lows from 3.96%, the back up to 4.14%.
See charts below.
Technical Matters
Mortgage rates failed to follow through to new lows when Treasury yields declined sharply.
Mortgage rates show subtle signs of bottoming before T-Notes Yields Reversed.
On Friday, February 27, 2026, Treasury rates closed sharply lower compared to mortgage rates, which declined only 0.01%. The 10-year T-Note showed healthy improvement despite a strong inflationary release in the PPI, which ignored the news which typically causes weaker prices and higher yields/rates.
This was a subtle sign that mortgage rates showed resistance to improving relative to Treasuries.
On Monday, March 2, Treasury 10 Yr Notes Futures prices experienced a key reversal with prices(values) falling sharply turning the Yields from yearly lows to higher levels, and mortgage rates followed suit, giving back their part of their improvement since the announcement of Fannie/Freddie mortgage purchase plan.
Summary
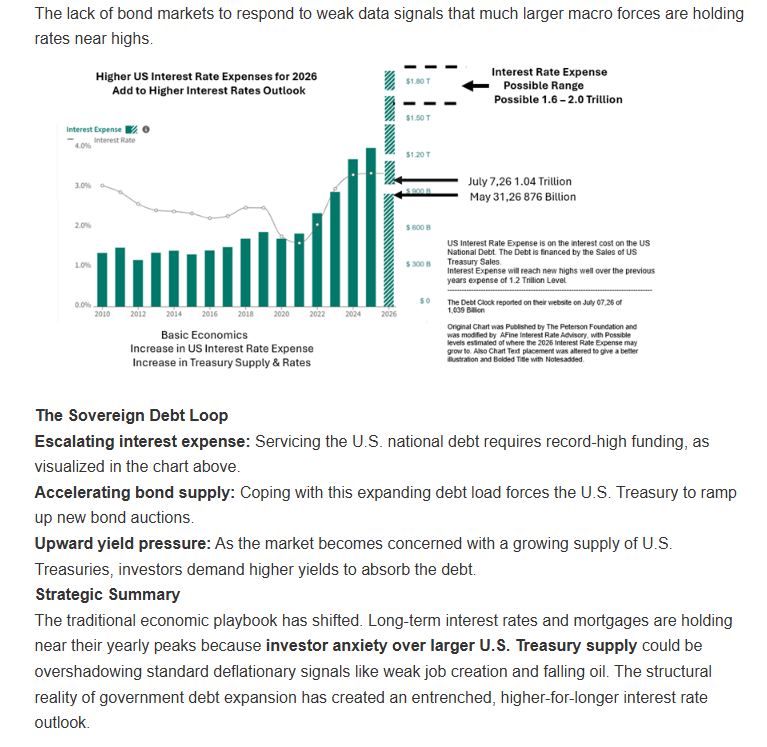
30Yr Mortgage Rate Index showed early signs of bottoming holding the 6.00% lows before the T-Notes Futures had a key reversal in price highs, lunching a reversal in their yields/rates from their yearly lows 3.96% to 4.14%. Investors focus shifting back to Inflationary concerns with hints from a higher Producer Price Index and the cost of the Iranian War. In the background the US National Debt is approaching 39trillion. An upward interest rate cycle developing for long term rates.
Source Notes *Housing Wire article Jan Fannie/Freddie first reserves purchase.