
Mortgage & Treasuries Maintain Rate Easing

Alan Fine • November 13, 2026

Constructive Behavior in the Treasury & Mortgage Markets
October 14th — Treasury Market Resilience Following Higher Inflation Report

On October 14th, the Treasury market demonstrated a positive response following a higher-than-expected CPI inflation report, successfully resisting the upward pressure typically associated with stronger inflation data.

This market behavior confused commentators, as media coverage focused primarily on the inflation outlook rather than the stability and strength of Treasury prices by the close of trading. The prevailing commentary centered on the possibility of the Fed increasing rates, overlooking what the long-term interest rate markets were signaling: the potential beginning of a new rate-easing cycle.

Technical indicators revealed a key upward reversal in 10-Year Treasury Note prices, suggesting that yields and interest rates are topping.


Continued Easing Trend in Treasury & Mortgage Markets

The constructive behavior in both the Treasury and Mortgage markets continued to unfold.

Interest rates improved throughout the remainder of October 2026, despite a rally in U.S. crude oil prices to $105 per barrel and renewed inflationary concerns within the energy sector.


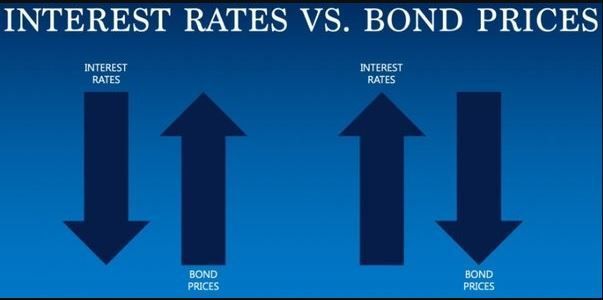
Several episodes of Flight to Safety into Treasuries and Mortgage-Backed Securities were clear as equity markets experienced days of sharp declines. These movements reflected capital flowing into the long-term debt markets, providing support for Treasury and Mortgage prices while pushing yields and interest rates lower.


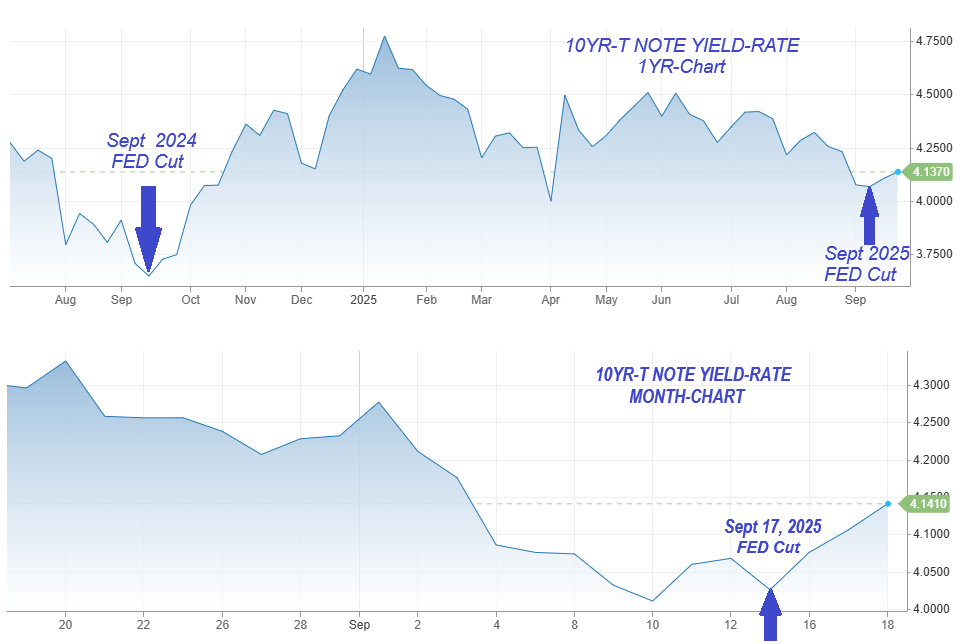
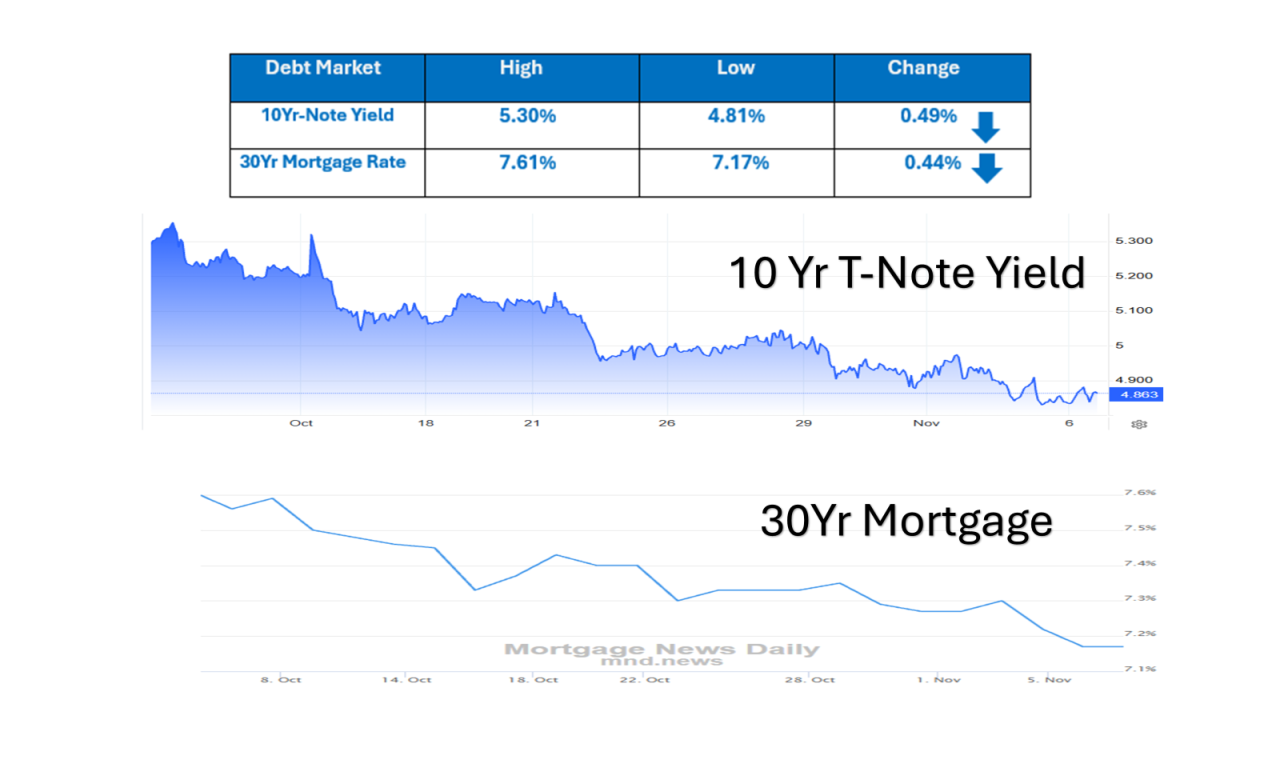
The result was a significant decline in 10-Year Treasury Note yields and 30-Year Mortgage rates. See Charts.


November 6th — Strong Employment Report Fails to Derail Easing Rate Trend

The November 6th Monthly Employment Report showed nonfarm payrolls increasing by 165,000 jobs, approximately 100,000 more than expected.

This strong employment report—one that would normally place considerable downward pressure on Treasury and Mortgage-Backed Security prices, potentially driving yields and mortgage rates higher.

However, the interest rate markets continued to demonstrate resilience, absorbing much of the stronger-than-expected employment news with minor change to yield/rates.


Summary The technical indicators showed clear reversal chart patterns in debt markets prices strengthen from recent lows, & positive market behavior. Consistent buyer demand come into the long-term debt market biding up prices, which translates to easing rates.

 Three weeks after the Sept CPI Report (released in Oct) rates/yields fell sharply. See chart below. A Cardinal Rule in Market Analysis is not to fight the trend. The Easing Interest Rate Cycle remains in tacked.

By Alan Fine • July 15, 2026
Weaker Jobs Report & Failing Oil Prices
By Alan Fine • March 1, 2026
Long Term Uptrend Indicators
By Alan Fine • September 24, 2025
Troubling Signs for Interest Rates after Fed Cut
Short-Term Improvements vs. Major Trend of Rates
By Alan Fine • March 11, 2025
The stock market gave back earlier gains for the year, and investors sought safety by moving into the Treasury and mortgage markets, which caused this easing phase of interest rates by the first of March 2025. The 10-year note yield (rate) dropped to 4.20%, and the 30-year mortgage rate hit 6.70%.
Trumping the Fed & Interest Rates
By Alan Fine • February 25, 2025
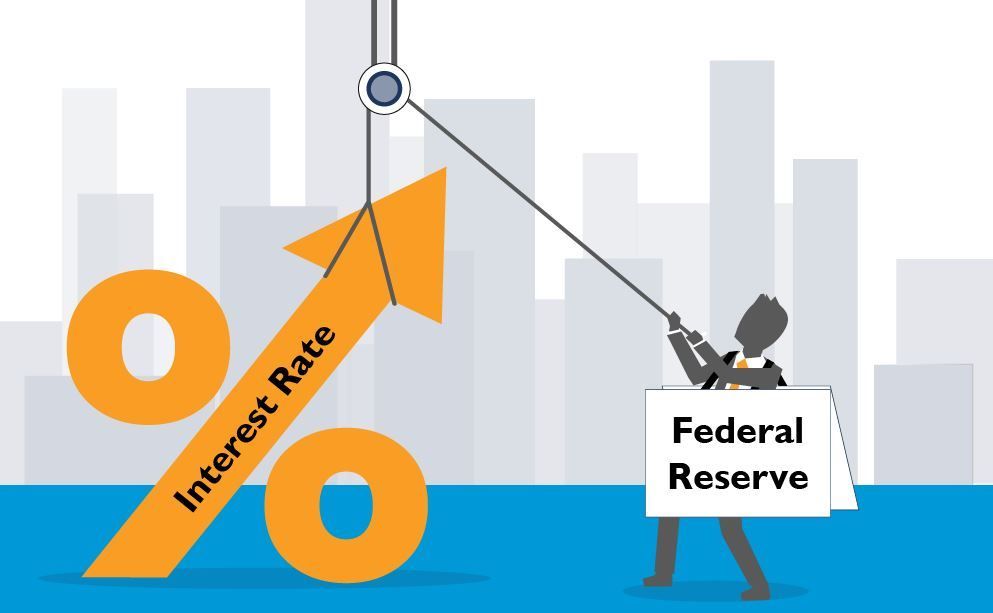
The Fed only directly controls short-term interest rates. The borrowing costs that matter most for consumers are medium and long-term interest rates. These rates are set in global bond markets by traders who are betting on countless factors, including how high and volatile inflation will turn out to be, the strength of growth and investment, and how much debt the U.S. government issues — and in turn how the Fed will react to all of that.
Flight to Insecurity in the Face of a Fed Rate Cut
By Alan Fine • August 3, 2024
Though the initial market reaction of economic fears to falling global stock prices, fooled investors buying Treasury and easing rates to their recent lows occurring before the Fed Rate Cut. This is where the technical indicators show their value they indicated bottoming of rates. Since the Fed Cut, the Mortgage & Treasury Rates (Yields) shot significantly higher.
Behind the Debt Ceiling
By Alan Fine • July 29, 2023
Debt Ceiling and Interest Payments: The ongoing debt ceiling faceoff highlights the underlying issues of US national debt growth and the acceleration of interest costs. The high US Debt is a major inflation factor that lead to high interest rates.
10Yr Treasury Note Analysis A Technical Case for Higher Rates
By Alan Fine • January 21, 2023
The 10Yr Note, is the benchmark instrument that is analyzed by technical tools. These tools charts & indicators provide an objective and consistent view of the major trend of rates.
Market Review After Peak Correction
By Alan Fine • August 12, 2022
Market Review after a Peak Correction
Mortgage Rates Move Ahead of Fed
By Alan Fine • May 10, 2022
Brief review of mortgage rates moving sharply higher before any Fed Funds changes.
Bonds Dictate the Trend of Interest Rates
By Alan Fine • February 12, 2022
This discusses the upward movements that occurred in the Bond & Mortgage rates prompted by rising inflation seen by the sharp increase in the Consumer Price Index that well exceeded the Fed’s target inflation rate of 2.0%. It is a myth the Fed has ultimate control of consumer & investors interest rates.
The End of Easy Money the Fed's Policy Shift
By Alan Fine • November 27, 2021
An insightful overview that early identified a major up trend of interest rates months before the Fed made their first increase in the Fed Funds Rate. The Past 13 yrs of easy money policy ending, and new cycle to follow is an uptrend for interest rates. Note Mortgage Rates were 3.10% when written.
More Posts